Version 1 – Frontend
The frontend of Praport Version 1 was built entirely using raw HTML, CSS, and a small amount of vanilla JavaScript. At this early stage, I avoided any modern frontend frameworks like React or Vue — not because they weren’t useful, but because I didn’t understand them yet. My priority was simplicity, and getting something working.
My first live landing page was functional but minimal. It featured a simple input field, a button, and a couple of styled divs to guide the user. It only took around 15 lines of code to create something that could already accept user input and look somewhat structured.
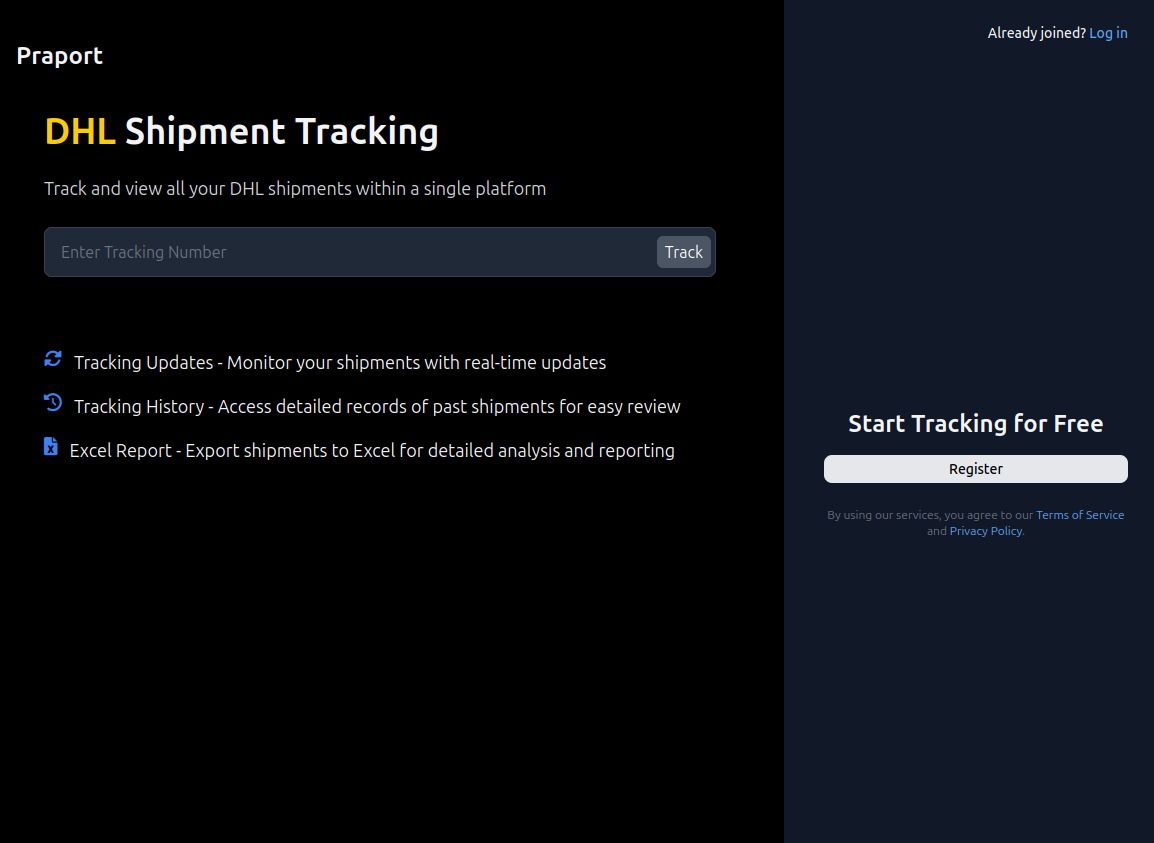
<h1>DHL Shipment Tracking</h1>
<p>Track and view all your DHL shipments</p>
<input type="text" placeholder="Enter Tracking Number">
<button>Track</button>
Registration Simplicity
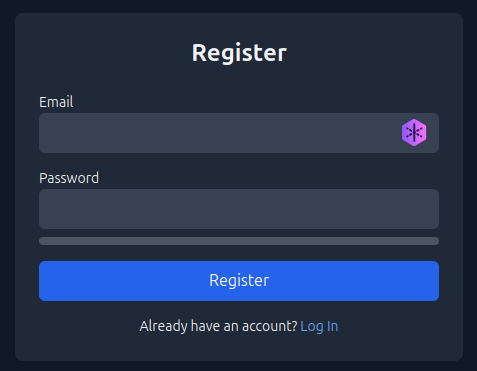
I intentionally designed the registration process to be as fast as possible. The form asked only for an email and password — no name, no birthday, no verification step. The goal was to get users into the app and using the dashboard within seconds.
Dashboard Interface & Shipment Counting
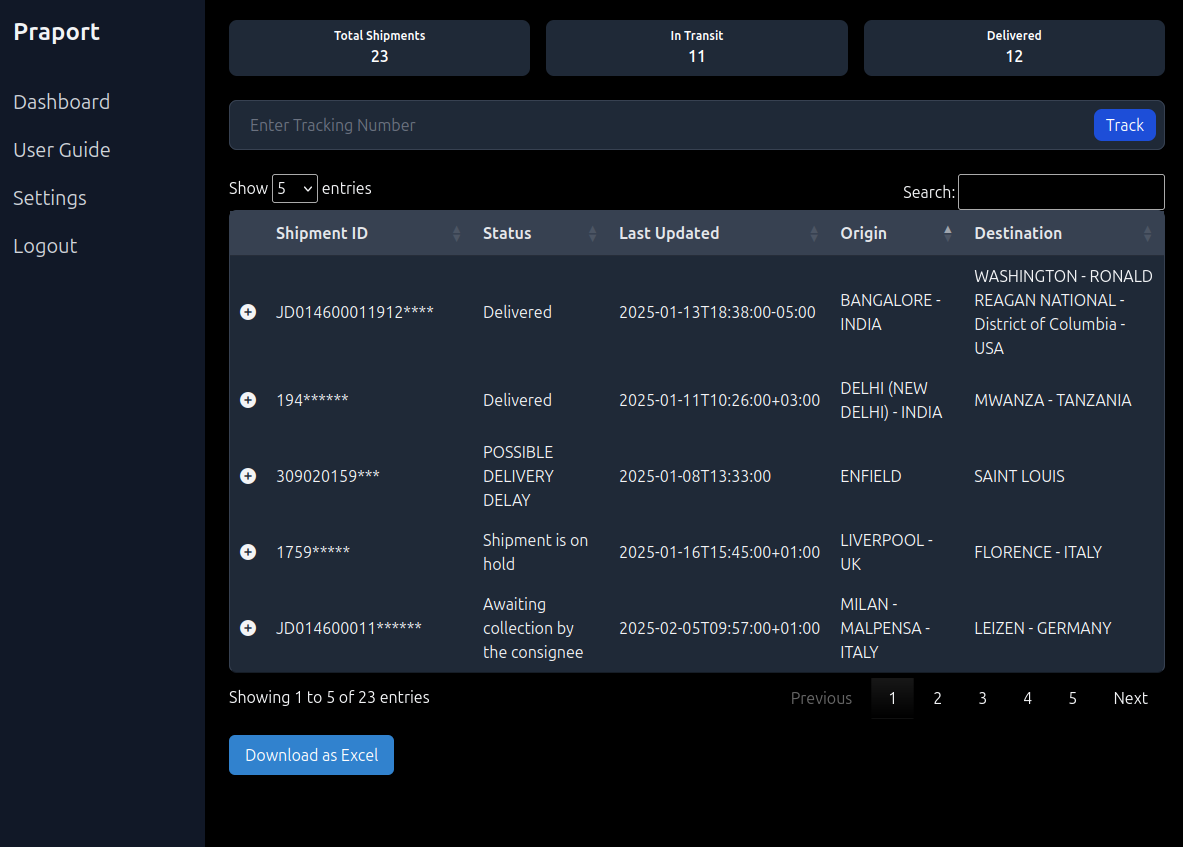
Once logged in, users were directed to the shipment dashboard. This page used a basic HTML table powered by the DataTables.js plugin. On top of the table, three counters showed total shipments, how many were delivered, and how many were still in transit. These were calculated purely on the frontend by parsing the contents of each table row.
const shipments = table.rows().data().toArray();
const totalCount = shipments.length;
const deliveredCount = shipments.filter(s =>
  s[2].toLowerCase().includes('delivered')
).length;
const inTransitCount = totalCount - deliveredCount;

document.getElementById('total-shipments').textContent = totalCount;
document.getElementById('delivered').textContent = deliveredCount;
document.getElementById('in-transit').textContent = inTransitCount;
These calculations were updated every time a new shipment was added to the table, ensuring the counters stayed in sync with the data displayed below.
Exporting to Excel
A vital feature for many users in logistics was being able to export their shipment list. I implemented an “Export to Excel” button using plain JavaScript that converted all visible data into a CSV and triggered a file download directly in the browser.
const data = table.rows().data().toArray();
const headers = ['Shipment ID', 'Status', 'Last Updated', 'Origin', 'Destination'];
const csvData = [headers, ...data.map(row => row.slice(1))];

const csvContent = csvData.map(e => e.join(',')).join('
');
const blob = new Blob([csvContent], { type: 'text/csv;charset=utf-8;' });
const link = document.createElement('a');
link.href = URL.createObjectURL(blob);
link.download = 'shipments.csv';
link.click();
User Guide
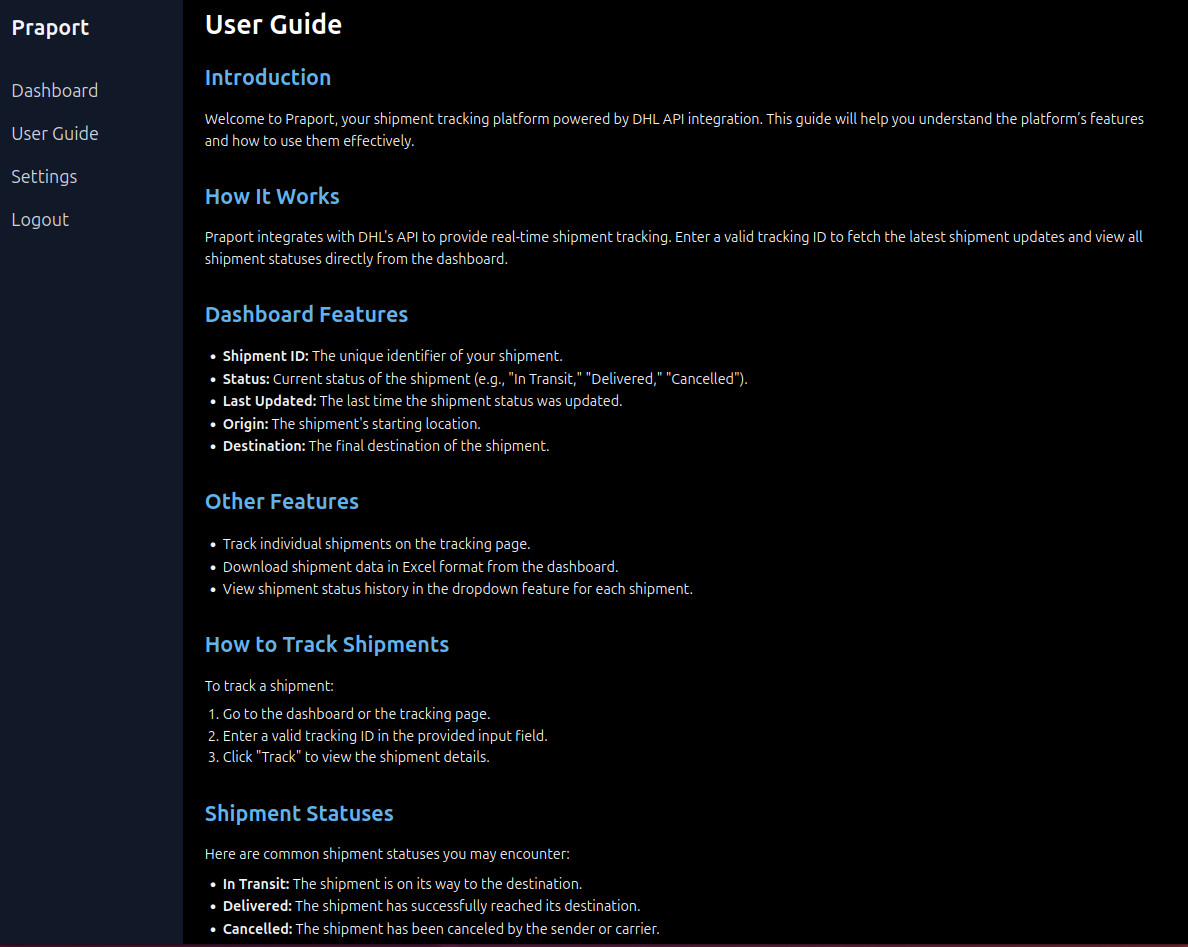
As a final touch, I created a visual user guide embedded directly in the dashboard. This explained each feature, how to use tracking, how the statuses worked, and what users could do within the platform.